출처 : http://www.upubuntu.com/2012/06/list-of-best-system-monitoring.html
A- CLI System Monitoring Tools & Commands
1. VMSTAT
Displays information about CPU, memory, processes, etc. Here are some command examples:
vmstat 3
vmstat -a
For more help:
vmstat --help
2. IOSTAT
This command line tool will display statistics about your CPU, I/O information for your hard disk partitions, Network File System (NFS), etc. To install iostat, run this command:
sudo apt-get install sysstat
To start the report, run this command:
iostat
To check only CPU statistics, use this command:
iostat -c
For hard disk:
iostat -d
For more parameters, use this command:
iostat --help
3. TOP

TOP is a command line tool that displays on the terminal active system processes in real-time. It also displays system device usage such as CPU, hard disk, swap, memory, etc. You can start it with this command:
top
To stop it, press CTRL+C. For more parameters, you can run this command:
top --help
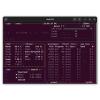
4. HTOP

HTOP is another system monitoring tool, but more advanced than the TOP command. HTOP is faster than TOP, and has a clean and organized interface that supports mouse operations. You can install HTOP as follows:
sudo apt-get install htop
5. MPSTAT
The mpstat command line utility will display average CPU usage per processor. To run it, use simply this command:
mpstat
For CPU usage per processor, use this command:
mpstat -P ALL
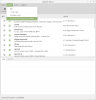
6. IPTRAF
IPTRAF is a command line utility that displays network statistics in real-time. Install it first with this command:
sudo apt-get install iptraf
To start monitoring network activities with IPTRAF, run simply this command:
sudo iptraf
In the screen that shows up, select which service to monitor and press Enter:

7. /PROC
To get information about system devices with the help of the /Proc file system, you can use these various commands:
cat /proc/cpuinfo
cat /proc/mounts
cat /proc/meminfo
cat /proc/zoneinfo
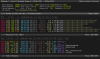
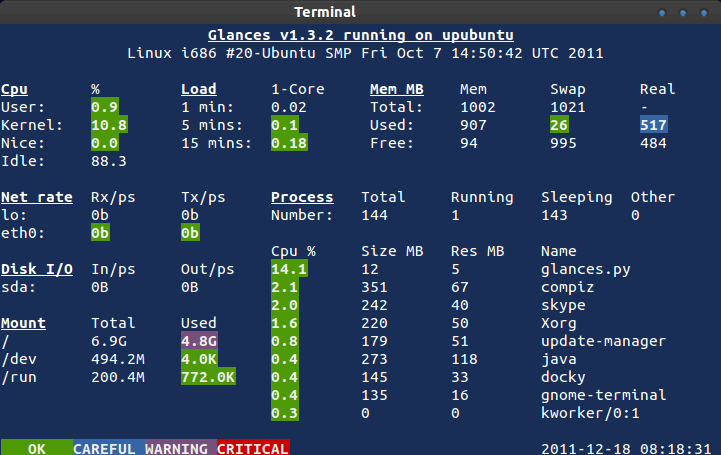
8. Glances
Glances is a system monitoring tool that displays in real-time CPU/memory/swap usage, load time, network activity, etc.
To install Glances, run the following commands:
sudo add-apt-repository ppa:arnaud-hartmann/glances-stable
sudo apt-get update
sudo apt-get install glances
To start system monitoring, issue this command:
glances.py
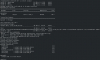
9. Saidar
Saidar also allows to monitor system device activities via the command line.

You can install is with this command:
sudo apt-get install saidar
To start monitoring, run this command:
saidar -c -d 1
Stats will be refreshed every second.
B- System Monitoring Software With GUI
1. Gnome System Monitor
For Ubuntu 12.04/Linux Mint13, you can use the pre-installed Gnome System Monitor for checking information in real-time about system devices, active processes, file systems, etc.

2. GKrellM
GKrellM is a customizable widget with various themes that displays on your desktop system device information (CPU, temperature, memory, network, etc.).

To install GKrellM, run this command:
sudo apt-get install gkrellm
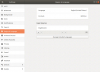
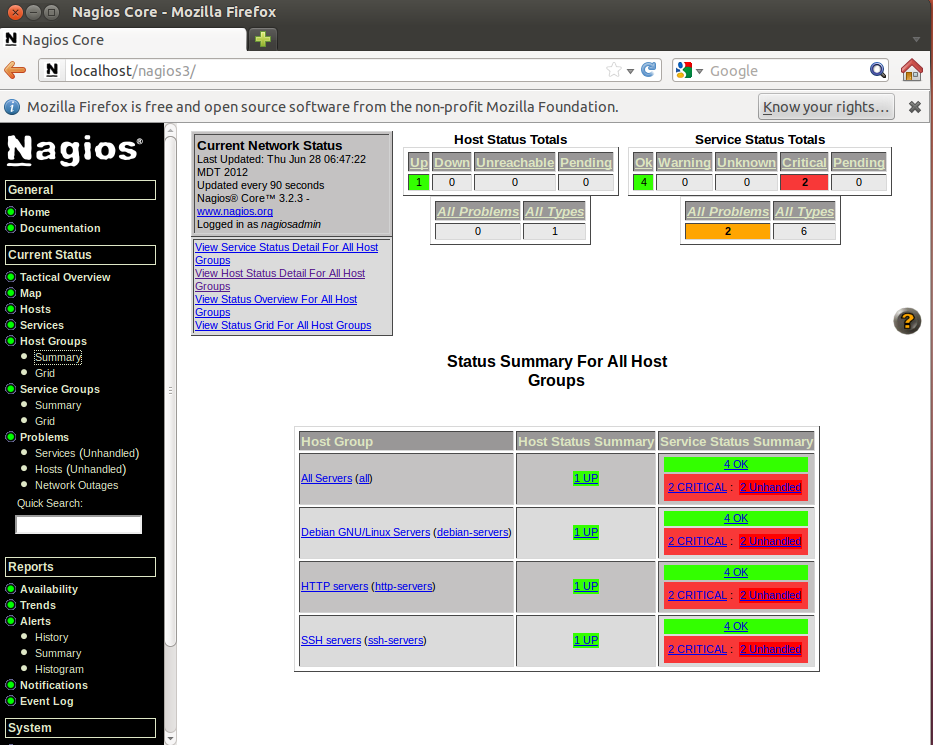
3. Nagios
A system & network monitoring application that allows to monitor system and network activity via a web user interface.
To install Nagios, run this command:
sudo apt-get install nagios3
During the installation, you will be required to enter administration password, submit it and press Enter:

To start system & network monitoring, open now this URL:
http://localhost/nagios3
Login using these details:
username: nagiosadmin
password: the one selected during installation
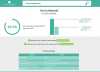
4. Monitorix
Monitorix is another application with a web-based user interface for monitoring system devices.

Install it with these commands:
sudo add-apt-repository ppa:upubuntu-com/ppa
sudo apt-get update
sudo apt-get install monitorix
Start Monitorix via this URL:
http://localhost/monitorix/
5. System Load Indicator
This application indicator is exclusive for Ubuntu. It displays on your upper panel, a menu containing various device usage such as CPU, memory, hard disk, load time, network download upload speed, etc.

To install System Load Indicator on Ubuntu 12.04, run these commands:
sudo add-apt-repository ppa:indicator-multiload/stable-daily
sudo apt-get update
sudo apt-get install indicator-multiload
6. Hardware Sensors Indicator
This indicator allows users to monitor temperatures of your CPU, hard disk, etc.

To install it on Ubuntu 12.04, run the following commands:
wget -O indicator-sensors_0.1-1_i386.deb http://goo.gl/268Jo
sudo dpkg -i indicator-sensors_0.1-1_i386.deb
7. i-Nex
A CPU-Z alternative for Linux that displays various device information (CPU brand & speed, motherboard, cache, sound, etc.).

Its installation is very simple, just run the following commands from the terminal:
sudo add-apt-repository ppa:i-nex-development-team/daily
sudo add-apt-repository ppa:nemh/gambas3
sudo apt-get update
sudo apt-get install i-nex
If you have another useful system monitoring tool, you can mention it below.
--------------------------------------------------------------------------------------광고(Advertising)--------------------------------------------------------------------------------------------------------